
Harmonic Patterns in Crypto: A Comprehensive Guide to Trading Success.
The volatility of the bitcoin market can be both thrilling and surprising, like sailing a stormy sea. Harmonic patterns are a potent ally for traders who are always looking for ways to predict market fluctuations. Based on Fibonacci ratios, these geometric patterns provide an organised method of spotting possible market reversals. Knowing harmonic patterns helps improve your crypto strategy, regardless of your level of experience. To assist you trade with confidence, we’ll dissect their types, workings, and real-world uses in this tutorial.and Harmonic Patterns in Crypto
What Are Harmonic Patterns?
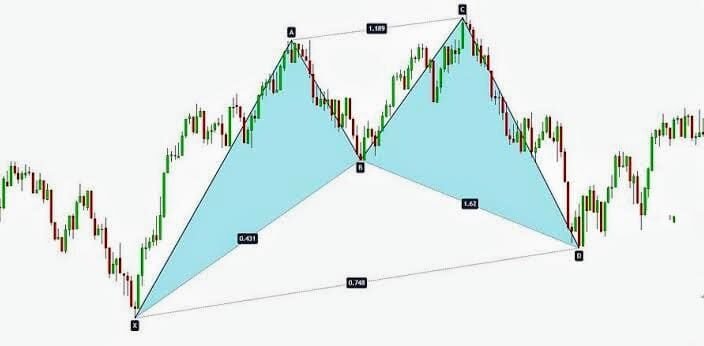
Advanced chart formations known as harmonic patterns use geometric forms in conjunction with Fibonacci retracement and extension levels to forecast market reversals. These patterns, which date back to H.M. Gartley’s research in the nineteenth century, are predicated on the notion that markets follow regular, organic cycles. To determine where prices may halt or reverse, traders employ ratios which include often known as the “Golden Ratio.” In the highly volatile world of cryptocurrency, these patterns provide clarity by cutting through the clutter.
The magic lies in their precision: Each pattern has strict rules for entry, stop-loss, and profit targets. For example, the Gartley pattern requires specific alignment of swing highs and lows with Fibonacci levels. While mastering them takes practice, their reliability in trending markets makes them a favorite among crypto enthusiasts.
Why Harmonic Patterns Matter in Crypto Trading:
Crypto’s 24/7 market cycles and rapid price swings demand strategies that balance risk and reward. Harmonic patterns excel here by providing clear signals amid chaos. Unlike basic indicators, they factor in both price and time, offering a holistic view of market psychology. Their reliance on Fibonacci ratios—a universal market phenomenon—adds a layer of mathematical rigor.
Consider Bitcoin’s 2021 bull run: Traders using harmonic patterns could have identified reversal zones near all-time highs, avoiding costly FOMO-driven mistakes. These patterns also adapt to any timeframe, from scalping minute charts to analyzing multi-week trends. In a market where timing is everything, harmonic strategies offer a disciplined edge.
Key Harmonic Patterns in Crypto Trader Should Know:

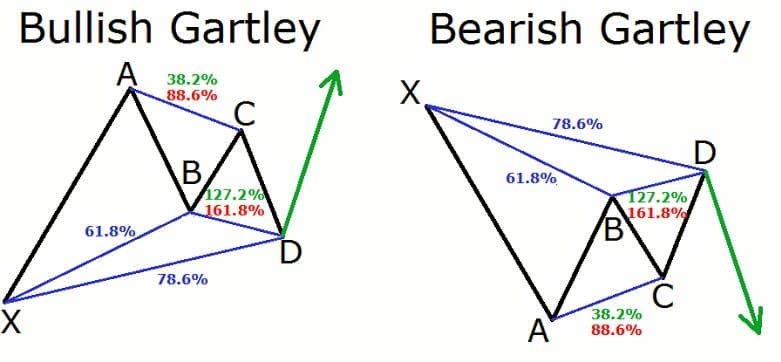
1) Gartley Pattern
The cornerstone of harmonic trading, the Gartley resembles an “M” or “W” shape. It signals reversals when the final leg (X-D) retraces 61.8% of the prior swing. Ideal for spotting trend exhaustion in assets like Ethereum.
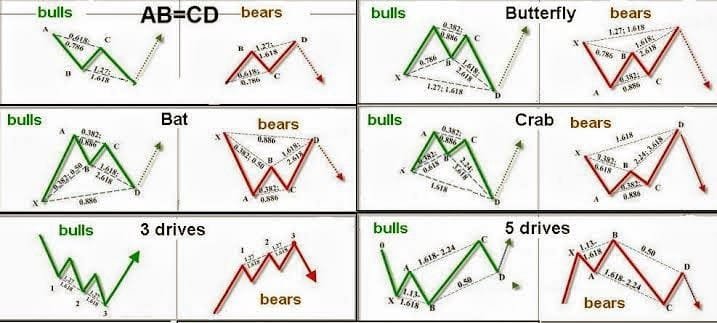
2) Butterfly Pattern:
Distinguished by its extended D point, the Butterfly often forms during market extremes. The CD leg typically extends 127.2% or 161.8% of the XA leg, flagging dramatic reversals—common in altcoin pumps.
3) Bat Pattern:
A tighter formation, the Bat’s PRZ (Potential Reversal Zone) hinges on an 88.6% retracement of the XA leg. Its accuracy in Bitcoin’s 4-hour charts makes it a go-to for swing traders.
4) Crab Pattern:
Known for aggressive reversals, the Crab’s CD leg extends up to 361.8% of XA. Watch for this during Bitcoin’s liquidity squeezes or Dogecoin’s meme-fueled rallies.
5) Shark Pattern:
A newer addition, the Shark identifies early trend shifts with its 113%-161.8% Fibonacci extensions. Perfect for catching SOL or ADA breakouts before they trend.
How to Spot Harmonic Patterns in Crypto Charts:
Start with a reliable charting platform like TradingView or Coinigy. Use Fibonacci tools to mark swing highs/lows and validate ratios. For example, in a Gartley pattern, the B point should retrace 61.8% of XA, while C retraces 38.2%-88.6% of AB.
Look for symmetry: Patterns like the Bat or Butterfly thrive on proportional legs. Confirm with volume spikes or RSI divergence to avoid false signals. Pro tip: Backtest historical BTC/USD charts to see how these patterns played out during major rallies or crashes.
Trading Strategies Using Harmonic Patterns in Crypto:
1) Entry Points:
Enter trades at the PRZ—where the pattern completes. For a Bullish Gartley, buy when price hits the D point with RSI oversold.
2) Stop-Loss Placement:
Set stops just beyond the PRZ. If trading a Bearish Crab, place a stop above the 361.8% extension to account for volatility.
3) Profit Targets:
Aim for 38.2%-61.8% retracements of the CD leg. In a Shark pattern, target 50% of the XA leg for quick gains.
4) Risk Management:
Limit trades to 1%-2% of your portfolio. Crypto’s leverage risks make disciplined sizing non-negotiable.
5) Backtesting:
Use platforms like Binance Futures’ historical data to refine your approach. Track win rates and adjust Fibonacci levels as needed.
Common Pitfalls to Avoid:
1) Ignoring Market Context:
Bullish Bat pattern during a macro bearish trend? Think twice. Always align patterns with higher-timeframe trends.
2) Overcomplicating Analysis:
Stick to classic patterns first. Novices often mix ratios, leading to flawed setups.
3) Neglecting Confirmation:
Wait for a bullish engulfing candle or MACD crossover post-PRZ. Patience prevents false entries.
4) Chasing Perfection:
Not every pattern will align perfectly. Use them as guides, not gospel.
5) Skipping Practice:
Demo trade for weeks before risking capital. Mastery requires screen time and humility.
Conclusion:
Harmonic patterns are more than just lines on a chart—they’re a lens into market psychology. By blending Fibonacci math with disciplined strategy, you can anticipate turns in Bitcoin, Ethereum, or emerging altcoins. Remember, no tool guarantees success, but harmonic patterns stack probabilities in your favor. Start small, stay patient, and let the markets reveal their rhythms.
Ready to dive deeper? Pair harmonic patterns with candlestick analysis or on-chain metrics for a 360° trading approach. The crypto waves are waiting—surf them wisely.
Final Tip:
Bookmark this guide and revisit it as you practice. Mastery comes not from memorizing patterns, but from understanding the story they tell. Happy trading!