
Mastering Fibonacci Trading in Crypto: A Comprehensive Guide to Unlocking Profitable Trades
Technical analysis is probably nothing novel to you as a cryptocurrency trader. Fibonacci trading, a strategy for forecasting price changes and spotting possible trading opportunities, is among your most successful instruments. We will examine the history, tenets, and uses of Fibonacci trading in cryptocurrency in this extensive book.
Introduction to Fibonacci Trading in Crypto:
This Fibonacci tool can support the traders’ level of identifying places where an asset’s price could reverse or consolidate. The invention of Leonardo Fibonacci, an authentic Italian mathematician of the thirteenth century, created this tool based on a Fibonacci sequence that refers to the list of numbers where each is a sum of two numbers directly before it, for instance, 1, 1, 2, 3, 5, 8, 13, and so on
What is Fibonacci Trading and How Does it Work?
Fibonacci trading is a technique in technical analysis that makes use of market prices’ inclination to naturally retrace a small piece of their prior movement before continuing in their original path. To make it simple for traders to identify possible support and resistance locations, it employs a sequence of levels that are positioned at pivotal moments and modified to reflect a percentage of the prior price movement. The most widely used Fibonacci levels are those associated with the retracement thresholds of 23.6%, 38.2%, 50%, 61.8%, and 76.4%, which have been shown statistically to have a significant effect on the market.
These levels are used to identify potential areas of support and resistance, where the price is likely to reverse or consolidate.
How to Apply Fibonacci in Crypto ?
1) Dentify the trend:
Identifying the trend using Fibonacci analysis requires a delicate balance of technical indicators, chart patterns, and a thorough understanding of market dynamics. Using Fibonacci levels, including the twenty-three percen and sixty-one percent retracement thresholds, traders can discover probable locations of support and resistance to influence their trading decisions. A detailed review of price movement and Fibonacci levels allows traders to identify trends and make data-driven judgements, ultimately optimising their trading techniques. Traders that understand how to detect Fibonacci trends in the cryptocurrency market are more positioned to capitalise on developing opportunities, minimise potential losses, and navigate this complex market.
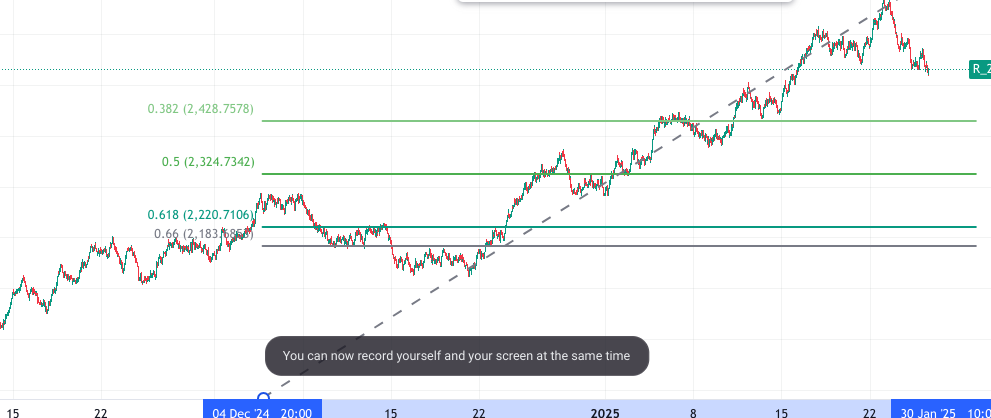
2) Draw the Fibonacci levels:
Traders often begin by finding the high and low points of a recent price swing before calculating the critical retracement levels. The twenty-three percent, fifty percent, sixty-one percent, and seventy six percent levels are frequently utilised and are represented by horizontal lines on the chart to show probable regions of support and resistance. These levels can be tailored to the exact market and time frame being traded, and they can be combined with other technical indicators to create a comprehensive trading strategy. Traders can use Fibonacci levels to visualise probable price changes and make better judgements about when to enter or quit a transaction.
3) Identify support and resistance:
Finding support and resistance levels in Fibonacci analysis is essential for forecasting probable price breakouts and reversals. While the fifty percent and 76.4% levels are frequently viewed as resistance zones, the twenty-three percent, 38.2%, and sixty-one percent retracement levels are frequently utilised to identify regions of support. Traders might determine the strength of the support and resistance levels and decide when to buy or sell through analysing the price action and Fibonacci levels. Fibonacci analysis’s ability to accurately identify support and resistance levels can help traders anticipate future market movements and optimise earnings while minimising losses.
4) Look for confluence:
To find high-probability trading opportunities with Fibonacci analysis, one of the most important steps is to search for confluence. Confluence is the formation of a strong area of support or resistance when several Fibonacci levels, such as the twenty-three percent and retracement levels, align with other technical indicators or chart patterns. Traders can lower the chance of erroneous signals and improve the accuracy of their trade forecasts by searching for confluence. Confluence can be an effective technique for spotting trading opportunities in Fibonacci analysis since it can show a high degree of market agreement and raise the possibility of a price breakout or reversal.
Real-World Examples of Fibonacci Trading in Crypto:

Let’s take a look at a few real-world examples of Fibonacci trading in crypto:
1) Bitcoin (BTC):
The price of Bitcoin rose from $3,000 to $13,000 in 2020 before falling back to $9,000. The price recovered to $12,000 after acting as a solid support at the 50% Fibonacci level ($8,500).
2) Ethereum (ETH):
In 2019, Ethereum’s price dropped from $350 to $100, before retracing to $200. The 38.2% Fibonacci level ($220) acted as a moderate resistance, and the price consolidated before breaking out to $300.
Tips and Tricks for Using Fibonacci Trading in Crypto:
1) Use multiple time frames:
To improve the precision of your forecasts, apply Fibonacci trading on a variety of time frames, including the 1-hour, 4-hour, and daily charts.
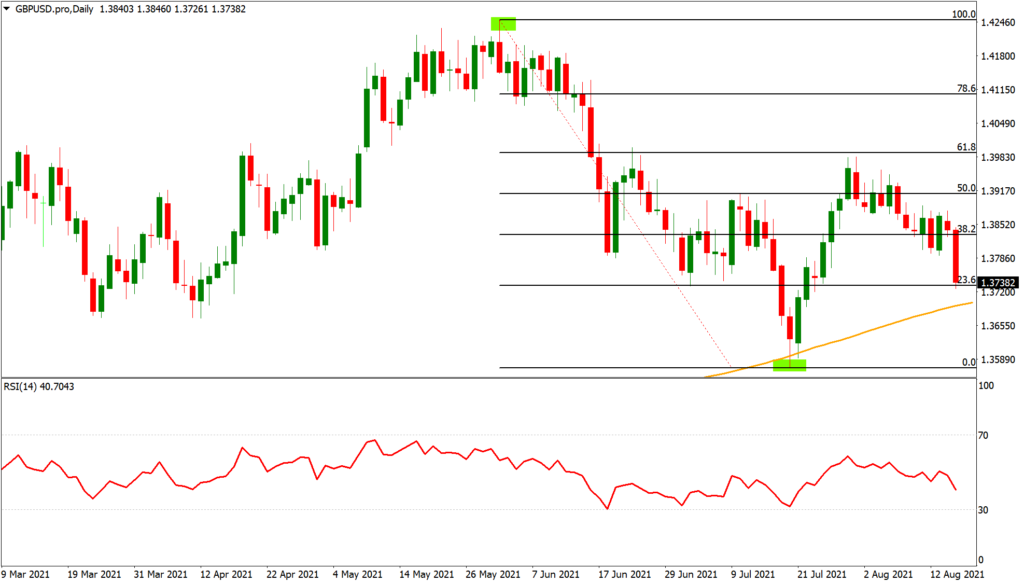
2) Combine with other tools:
To improve the accuracy of your forecasts, combine Fibonacci trading with additional technical analysis techniques like RSI and moving averages.
3) Look for confluence:
Look for confluence between Fibonacci levels and other technical analysis tools, such as support and resistance levels, to increase the accuracy of your predictions.
Conclusion:
In cryptocurrency trading, fibonacci trading is an effective strategy that lets you forecast price changes and spot possible trading opportunities. You may discover the mysteries of Fibonacci trading and advance your cryptocurrency trading by following the instructions in this article.
2 thoughts on “What is Fibonacci Trading in Crypto 2025”